One of the inevitable aspects of data migration is dealing with fallout from automated data loads. Typically, this process includes identifying the data that will not load, analyzing the error messages to determine the root cause, formatting a readable report that can be used as a tool in the cleanup process, and fixing the root cause of the problem so that it does not happen again.
Why the data will not load correctly.
There is a litany of reasons why some data records will load correctly while others will not. Here is a list of some common root causes:
-
-
Poor quality legacy data.
Legacy systems which are not as tightly integrated as SAP, and are not under master data control allow the end user a bit of freedom when entering data. A zip code may contain too little or too many characters; the email address is not properly formatted; numeric fields have transposed digits; various forms of abbreviations (especially in the city field), a quantity of zero (0) permitted by the legacy system and uploaded into a field where SAP will not accept a quantity of 0 and even simple misspellings all can cause stringent validation checks to trigger an error and prevent the record from loading at all. A more sinister type of error occurs when the data is functionally incorrect, but good enough to pass all of the SAP validity checks. In this case, the data record will technically load into SAP, but will not be functionally correct. Duplicate customers, duplicate vendors, and the data entry error for a quantity of 1000 instead of 100, and the wrong pricing condition applied to a sales order line are examples of this scenario.
-
-
Functional configuration and supporting data effects.
Many times I have watched the load statistics for a data object plummet from near 100% in the cycle two test load to near 0% in the cycle three test load. This is very unnerving to the client because the cycle three test load is getting rather close to the go-live date, and “by the way, shouldn’t the statistics be getting better rather than worse?” Functional configuration changes can wreak havoc on any data load. Flipping the switch on a data field from optional to required; turning on batch management or serialization for materials for the first time; changes in the handling of tax, tax codes, and tax jurisdiction codes; that account determination entry that is missing or not set up correctly; a missing unit of measure or unit or measure conversion factor; the storage location in the upload file which does not exist in SAP – any of these can cause a load to drop mostly or completely onto the floor.While change is inevitable on any project, it is important to control and communicate the change so that the downstream impact can be recognized and understood. Controlled change and communication always works better than total surprise. Perhaps if we all know ahead of time about that data field that is now required, we can impose a requirement on the data extract side to make sure that the data field is populated before it enters the upload file.
-
Additional data in the upload file.
Inserting a new field in the middle of the upload file data structure might be necessary for the business to close a gap, but if that change is not communicated to the technical team so that appropriate adjustments can be made to the load object’s input structures and processing logic, the new data will surely never load, and may cause misalignment of the data fields which follow it in the upload structure.
The Finger Pointing Game
It’s the load program! No, it’s the data! No, it’s the configuration! No, it’s … (fill in your favorite finger pointing game excuse explaining why data will not load).
If you ever find yourself in the midst of this type of finger-pointing game, immediately stop the madness. For this and similar situations, I apply a simple litmus test which has never failed me yet – manually enter the EXACT upload data into SAP for the transaction which has failed. If one can be entered manually, then the program will be able to automatically load thousands with similar upload data and functional configuration.
I have lead many a functional analyst – kicking, screaming, and ranting about how terrible the load program is – to the terminal to play “let’s enter one manually”. Typically, the result is that one cannot be entered manually due to configuration issues or the lack of supporting values data. Once these issues are cleaned up, the load program “magically” begins to process thousands of records with no trouble at all.
Sometimes, the load object appears to be the cause, but is not the root cause. The important data item not being handled by the load object (which was not called out in the functional specification document), the data item which turns blue (because the functional specification document explicitly stated “put this data item into the blue category”), the formula which is not calculating the desired result (but is indeed the exact formula found in the functional specification document) – all are examples of the load object adhering accurately to an incorrect functional specification document. The root cause, then, is the functional specification document which must first be revised and checked into the controlled document repository before making any code modifications.
It’s the Program
Well, OK, sometimes the load object is at fault. But it is extremely rare.
Collecting and Reporting the Technical Load Statistics
Load statistics are an important technical metric, indicating what percentage of the upload file has successfully posted a transaction into SAP. This is a basic and simple record count check. How many records were presented in the upload file, how many records posted successfully to SAP, and how many records failed to post. Also, does the number of successful transaction plus the number of failed transactions equal the total number of records presented in the upload file.
Here is how I communicate this technical metric:
| Total records in the upload file | 100 | |
| Successful technical transactions | 90 | 90% success |
| Failed technical transactions | 10 | 10% fail |
This technical metric indicates only that all of the SAP validation rules for posting the transaction have passed. It does not indicate that the master or transactional data posted to SAP is actually correct in functional terms.
The Functional Review
It is very possible for an entire upload file to technically load at 100%; while at the same time, functionally fail at 100%. The customer may be missing a partner, the material or article may be categorized incorrectly, the pricing conditions on a sales order may not have the desired validity date range, the GL posting may be to the wrong accounts. Hence, the need a functional review and validation of the data transacted into SAP. The data type – master or transactional – determines the type of functional review and metrics to be employed here.
For master data, such as of materials, customers, vendors, etc., it is impossible to individually validate the many thousands of entries in your SAP system. But statistical methods can be employed which will guide you through a random sampling of the data, while at the same time assuring accuracy at a high degree of confidence levels.
For transactional data, such as inventory, open sales orders, open AR, etc., direct mathematical comparisons can be employed. On a grand scale, if an inventory value of $15,246,321.44 is being moved from your legacy system to SAP, then that exact amount must arrive in SAP when the migration task is complete. It may be a bit more difficult to do this mathematical comparison at a more granular level. If, in the move to SAP you are also redesigning your material/storage location combinations, a direct comparison between the legacy system and SAP may not be possible without a translation factor. The same scenario exists if you redesign your GL chart of accounts, where one legacy GL account now maps to several SAP GL accounts, or vice versa.
Reporting the Fallout
If an automated data load was not technically 100% successful, a clear set of error messages complete with a link back to the legacy data must be mined, formatted, and presented to the business for analysis. Such a report really helps to facilitate the fallout cleanup. The link back to the legacy data must be carefully designed into the load process to make sure that, for example, the legacy customer number, legacy vendor number, legacy sales order number, legacy purchase order number, etc. is included as part of the data being handled. Without the link back to the legacy data, it becomes very difficult to identify which data record needs to be fixed.
The error message mining technique that I use depends on the load method. I will describe two here – one for a BDC load method and one for an IDOC load method.
Mining Meaningful Error Messages from a BDC Session Log
At the completion of a batch input session, the batch input session overview screen (SM35) displays the technical load statistics. In this example, out of a total of 229 transactions, 13 failed and 216 succeeded.
The session log shows the status of all 229 transactions. This screen snapshot is a fragment of the complete session log for the batch input session. It shows many successful transactions (Type = S) and one failed transaction (Type = E). The error message here is clear – the article does not exist or is not activated.
But as you can imagine, the 13 failed transactions with error type = E are sprinkled throughout the many pages of this log file. With only 229 transactions, this log file is quite easy to pick through to find the 13 errors. But imagine if the number of transactions were in the thousands or tens of thousands. How do we extract only the failed transactions and present a concise report of the failed transactions?
To do this, I use SAP transaction SM35P – Batch Input Log Overview. This transaction has the ability to set a filter on any field in the batch input log file, display the filtered results, and then to export the results to a local file.
To enter the mode where this is possible, first press the PRINT icon.
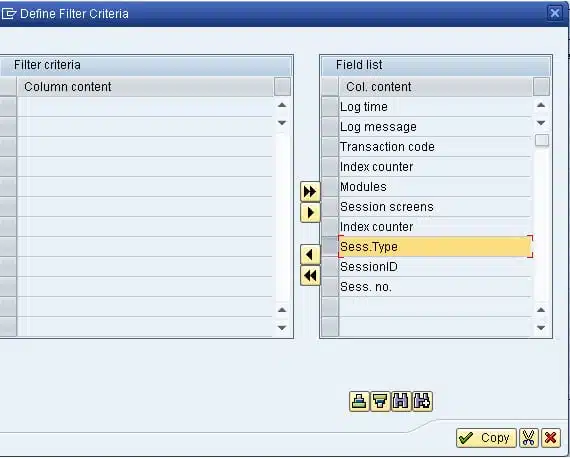
Next, set the filter. The appropriate filter field here is SESS. TYPE.
We only want the errors, so set the filter for field SESS. TYPE = E.
The display now shows only the 13 rows containing the error messages. This can be exported directly to a local spreadsheet for further analysis.
Mining Meaningful Error Messages from IDOCs
Depending on the IDOC and the processing module, mining the error status messages from IDOCs can be very easy or somewhat challenging. For the more difficult scenarios, you probably will need to hone your EXCEL skills to properly join several extracts together into one complete picture.
When creating IDOCs with a load object, I always note the date, time, and IDOC basic type. I will use this information as the selection criteria for transaction WE05, which is going to locate the IDOCs and display the results information I need after the IDOCs are processed. The results that I usually collect are the error status messages, and some data content from a segment or two to illustrate exactly where the problem is in the legacy data.
While the background job is busy processing the IDOCs, I usually take a peek, using transaction WE05, to see how the load is progressing. If I see that most of the IDOCs are falling onto the floor (IDOC status 51) rather than moving into the database (IDOC status 53), I usually stop the background job and begin an immediate analysis of the fallout. If the fallout solution does not require a change to the IDOC data content (e.g. a configuration change), then I can replay the fallout using SAP transaction BD87. If the fallout solution does require a change to the IDOC data content, then the complete set of IDOCs must be regenerated again.
Let’s see what WE05 can tell us about a completed Article Master load.
On the WE05 screen below, we can see that of the total of 14,005 IDOCs, 11,412 have processed successfully and 2,593 have failed to process. By double clicking the Status 51 folder, the display will show only the Status 51 IDOCs – the fallout.
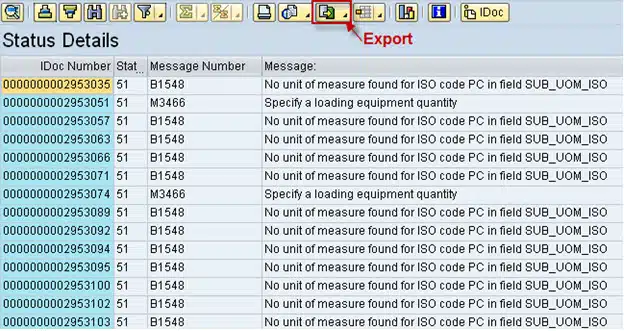
By pressing the “status list” icon (shown above), the display will show the status messages for the fallout. Once these messages are displayed, pressing the “export” icon allows me to save the screen contents to a spreadsheet.
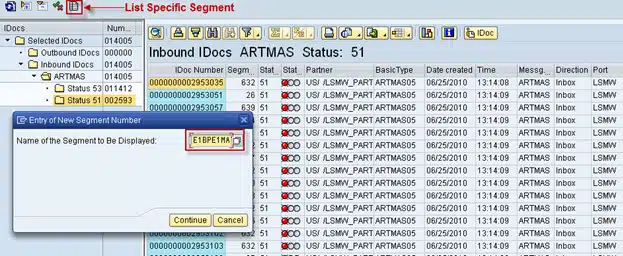
Now it would be really nice if I could have the article number in the spreadsheet right next to the error message. The article number in the ARTMAS IDOC is stored in segment E1BPE1MATHEAD. The segment content for each IDOC can be displayed by pressing the “list specific segment” icon and entering the segment name in the box.
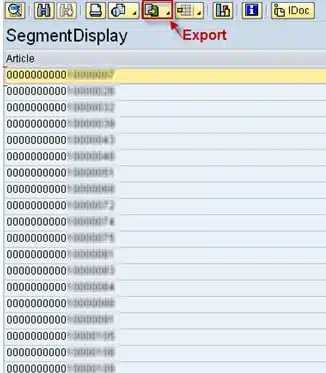
The segment display will show all fields in the segment, so I usually hide all of the columns that I don’t want to see. Here is the E1BPE1MATHEAD segment display showing only the article number. I can use the export icon to save the list of article numbers to another spreadsheet.
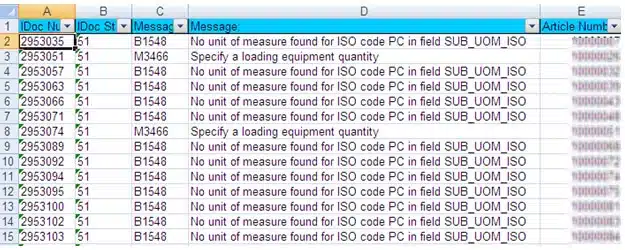
Here is a portion of the complete spreadsheet showing the error messages and the article numbers side by side.
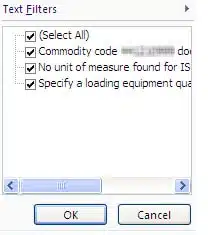
A filter applied to the spreadsheet shows that the 2,593 errors are all grouped into one of three error status categories. By selecting a single category, Excel will also show me the number of records within that failure category.
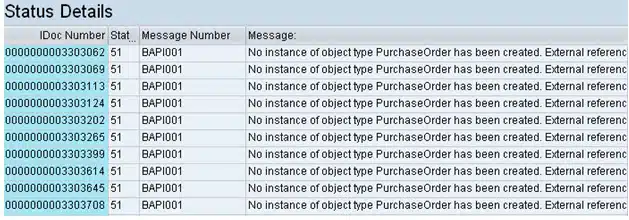
Sometimes it is easier to mine the status messages directly from the IDOC status table EDIDS. This is especially true where the processing module is a BAPI which returns an error table rather than a single error message. In this case, when you press the “status list” icon in WE05, only the first error status message of several is displayed for each IDOC. I find that the first message is not very helpful (as shown below). I also find that typically the second or third message in the return status table is usually the important one. You won’t see it displayed on the WE05 screen, but you can mine it from the EDIDS table.
SAP transactions SE11 or SE16 both support this activity. For the selection criteria I use the IDOC number range, status 51, and status type E. On the display screen, choose only the relevant fields for display – the IDOC number (DOCNUM), IDOC status (STATUS), status message (STATXT), the four substitution parameters for the status message (STAPA1, STAPA2, STAPA3, STAPA4) and the message type (STATYP). All of this can be exported into a spreadsheet. If you really want to test your Excel skills, you can write code that will move the substitution parameters into their placeholders in the status text.
Preparing for the next data migration cycle – Let the fallout analysis and cleanup begin.
Presenting the fallout report to the business with a set of clear error reasons and links back to the legacy data is key to enabling the legacy data cleanup process to proceed. In the iterative process of data migration cycles, cleansing the legacy data is a step in the right direction towards an improved next conversion cycle.
I hope you enjoyed this blog series on data migration. Please feel free to send comments or questions.






very helpful series, do u have any suggestion on the training to the business users who should responsible for the data collection? such as the training scope, key topics, interaction type, sampling? thanks a lot.
Very useful information. This helps me a lot and gave me idea about data migration!